Dry Bulk Weekly – August 30, 2010
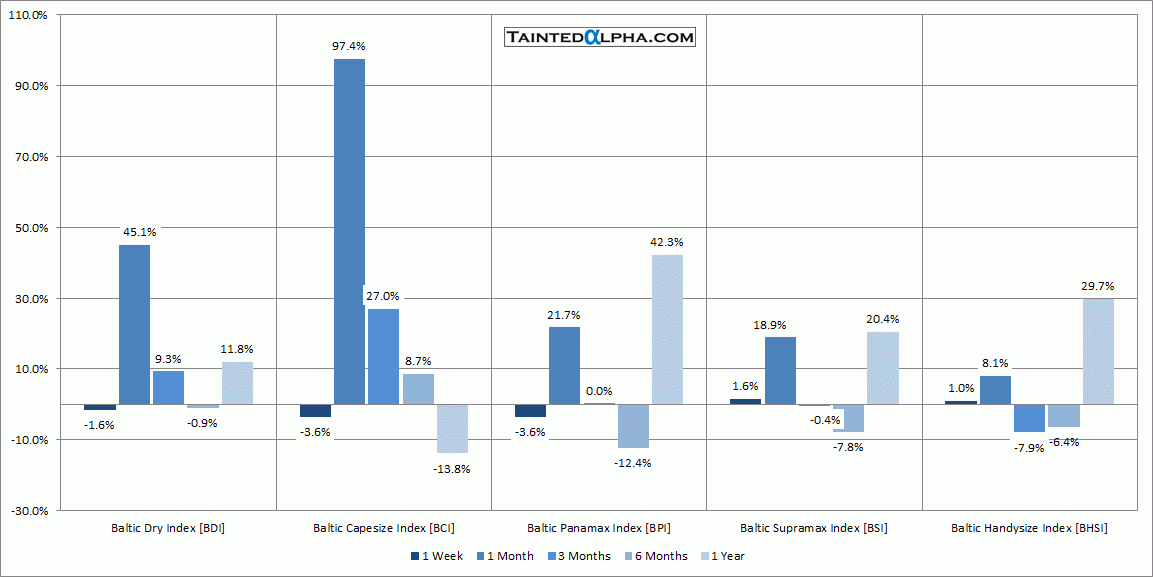
Baltic dry index fell 1.6% last week; Capesize Index fell 3.6%; Panamax Index fell also 3.6%; Supramax and Handysize Indexes gained 1.6% and 1.0% respectively.
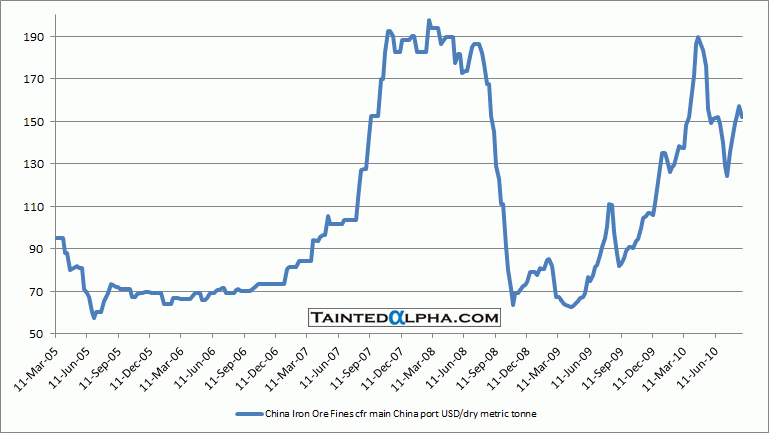
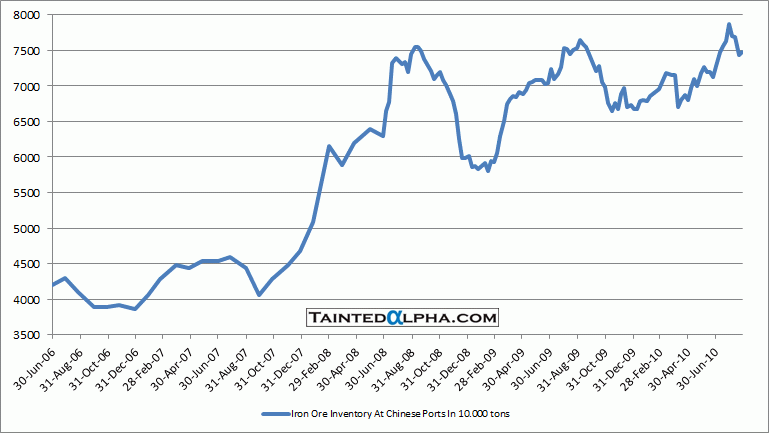
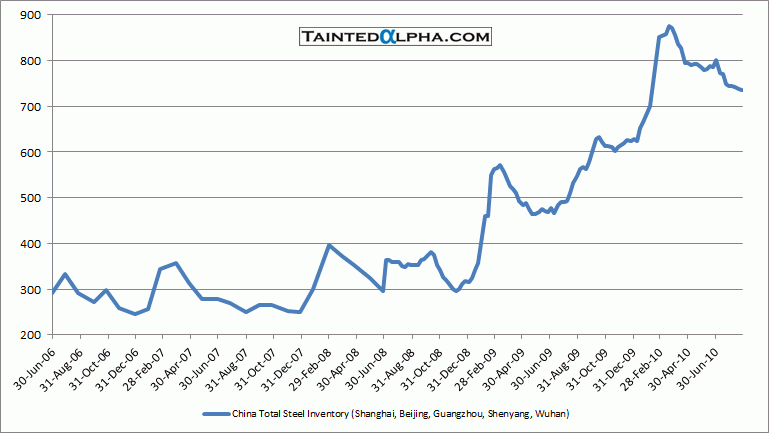
I added 3 new charts below. Iron ore and steel inventory (5 cities only, but I think it should work as a proxy) and iron ore price. The fundamentals are unchanged, high iron ore price doesn’t warrant steel mills positive margins. Inventory of both iron ore and steel is high.
Chart 1. Baltic Dry Indexes Relative Performance
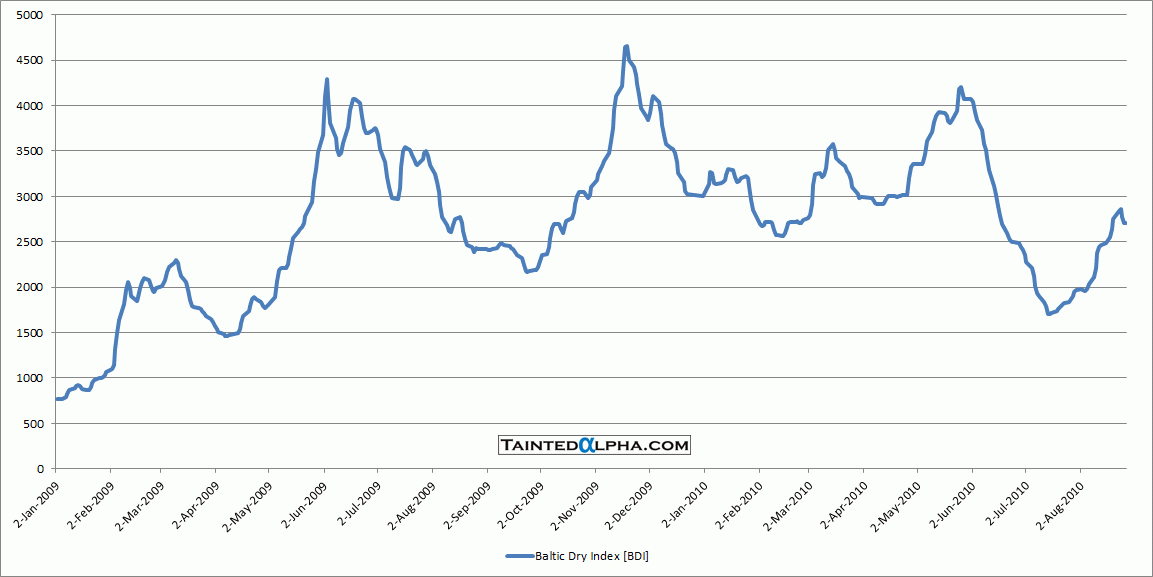
Chart 2. Baltic Dry Index
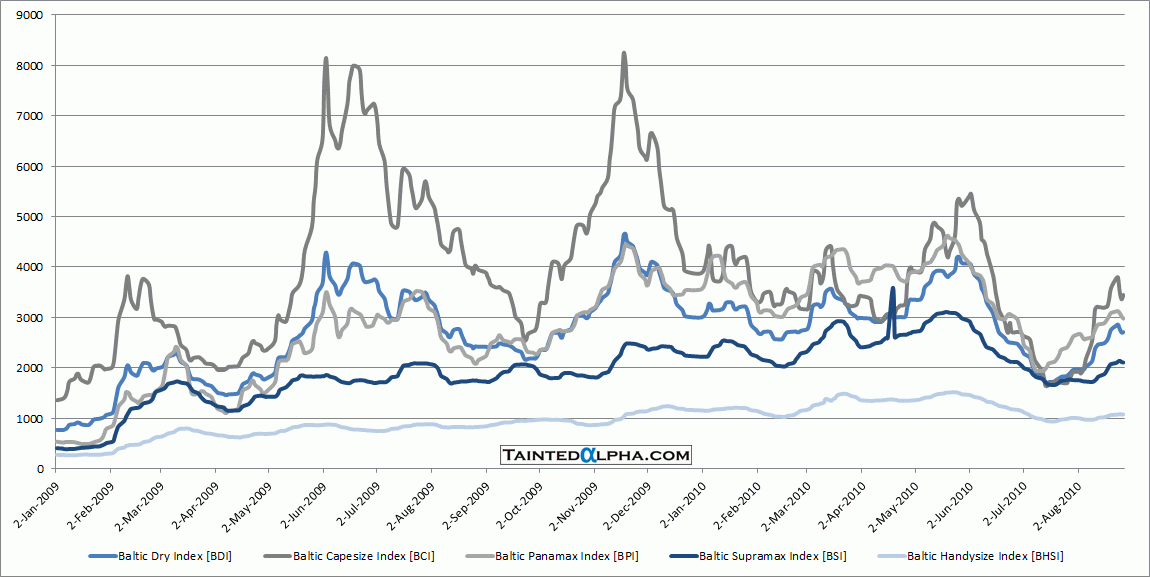
Chart 3. Baltic Dry Index Components
Chart 4. China Iron Ore Price Fines CFR Main China Port
Chart 5. Iron Ore Inventory At Chinese Ports
Chart 6. China Total Steel Inventory
